Description

EpiMelt HOXA9 test assay
Homo sapiens homeobox A9 (HOXA9), NM_152739
DNA Methylation Assay Kit for HOXA9 based on MS-HRM. Includes controls
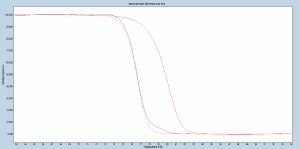
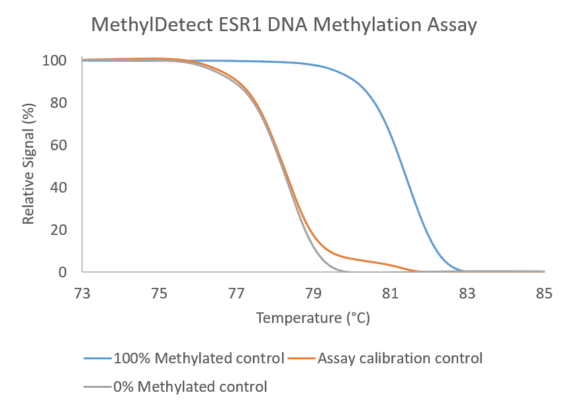
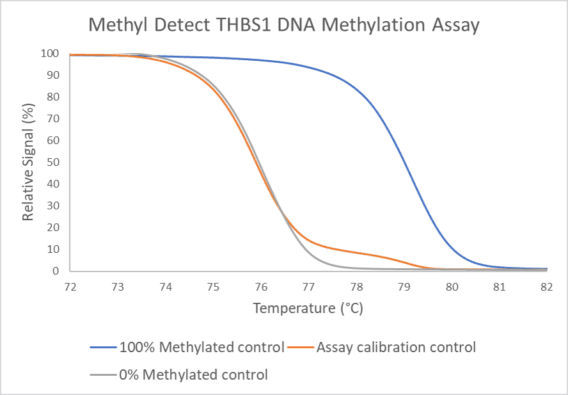
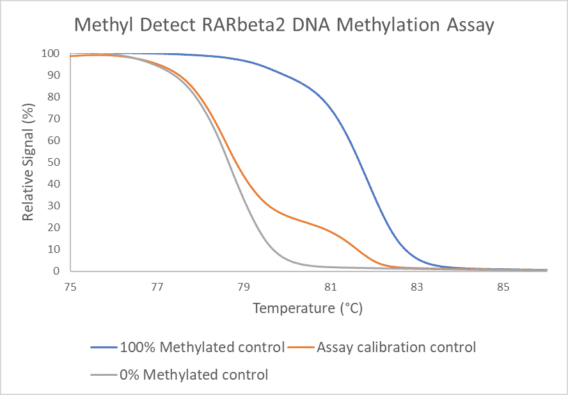
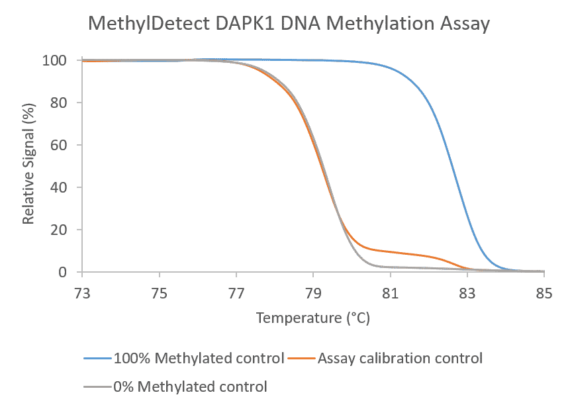
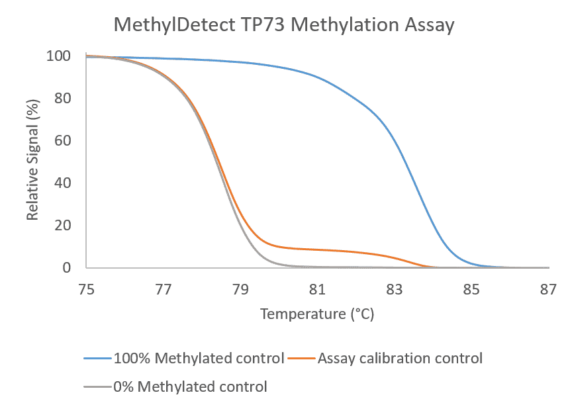
Normalized melting curves illustrating positive control (red), the assay calibration control (blue), and negative control (orange) of HOXA9 templates supplied with the MethylDetect HOXA9 kit.
Results obtained following the MethylDetect HOXA9 kit protocol, using the EpiMelt Real-Time PCR Master Mix. After PCR, the amplicons were analysed by high resolution melting curve analysis, and the data evaluated using the LightCycler® Gene scanning software.
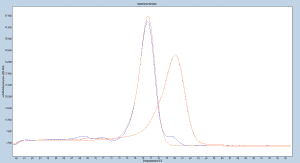
Relative signal difference (d/dT) plot illustrating the positive control (red), the assay calibration control (blue), and negative control (orange) of HOXA9 templates supplied with the MethylDetect HOXA9 kit.
Results obtained following the MethylDetect HOXA9 kit protocol, using the EpiMelt Real-Time PCR Master Mix. After PCR, the amplicons were analysed by high resolution melting curve analysis, and the data evaluated using the LightCycler® Gene scanning software.