Description
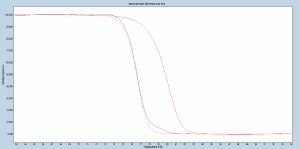
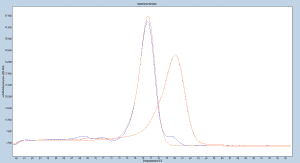
Normalized melting curves illustrating positive control (red), the assay calibration control (blue), and negative control (orange) of RUNX3 templates supplied with the MethylDetect RUNX3 kit.
Results obtained following the MethylDetect RUNX3 kit protocol, using the EpiMelt Real-Time PCR Master Mix. After PCR, the amplicons were analysed by high resolution melting curve analysis, and the data evaluated using the LightCycler® Gene scanning software.
Relative signal difference (d/dT) plot illustrating the positive control (red), the assay calibration control (blue), and negative control (orange) of RUNX3 templates supplied with the MethylDetect RUNX3 kit.
Results obtained following the MethylDetect RUNX3 kit protocol, using the EpiMelt Real-Time PCR Master Mix. After PCR, the amplicons were analysed by high resolution melting curve analysis, and the data evaluated using the LightCycler® Gene scanning software.